Treating University Analytics as Software: A Guide for R1 Research Data
Scalable, Version-Controlled Intelligence Engine for the Research Enterprise

Introduction
TL;DR: To move beyond static reports and manual spreadsheets, universities must treat analytics as a software engineering discipline. This requires a unified pipeline where data is ingested, modeled, versioned in GitHub, and deployed securely.
A modern university analytics ecosystem integrates data from core operational platforms into a single, scalable workflow. It transforms raw, siloed information into reliable strategic insights that leadership can trust.

The Challenge: Unifying the University
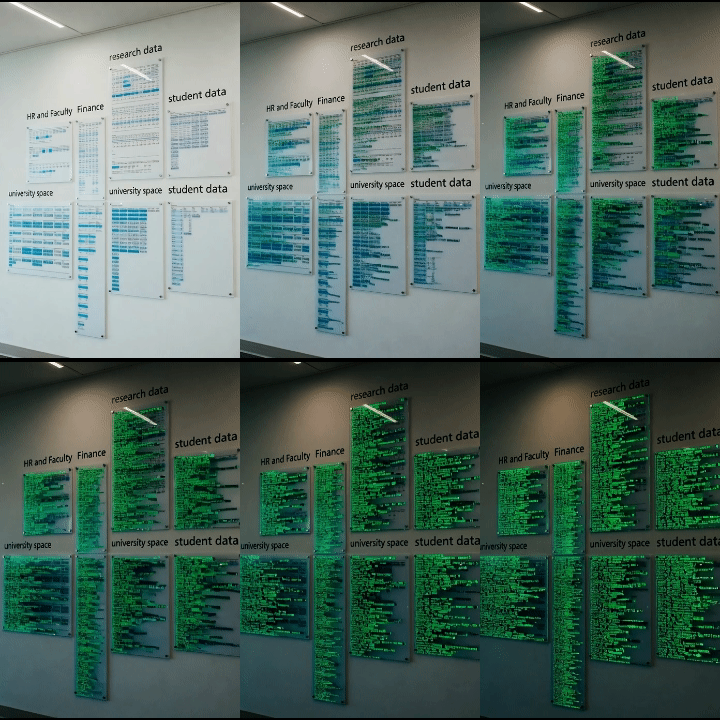
Universities depend on several major data domains to support analytics, compliance, and strategic planning. Bringing these traditionally gated systems into a single “source of truth” is the primary challenge of higher ed analytics.
The raw inputs for this lifecycle come from the following data domains. Each with its own security, culture, documentation, and last but not least, political landscape:
Student Information Systems (Enrollment, retention)
HR and Workforce (Faculty effort, staffing)
Sponsored Research (Grants, eRA activity)
Finance (General ledger, accounting)
Infrastructure (Space utilization)
Faculty Activity (Publications, awards)
The Solution: A Unified Lifecycle
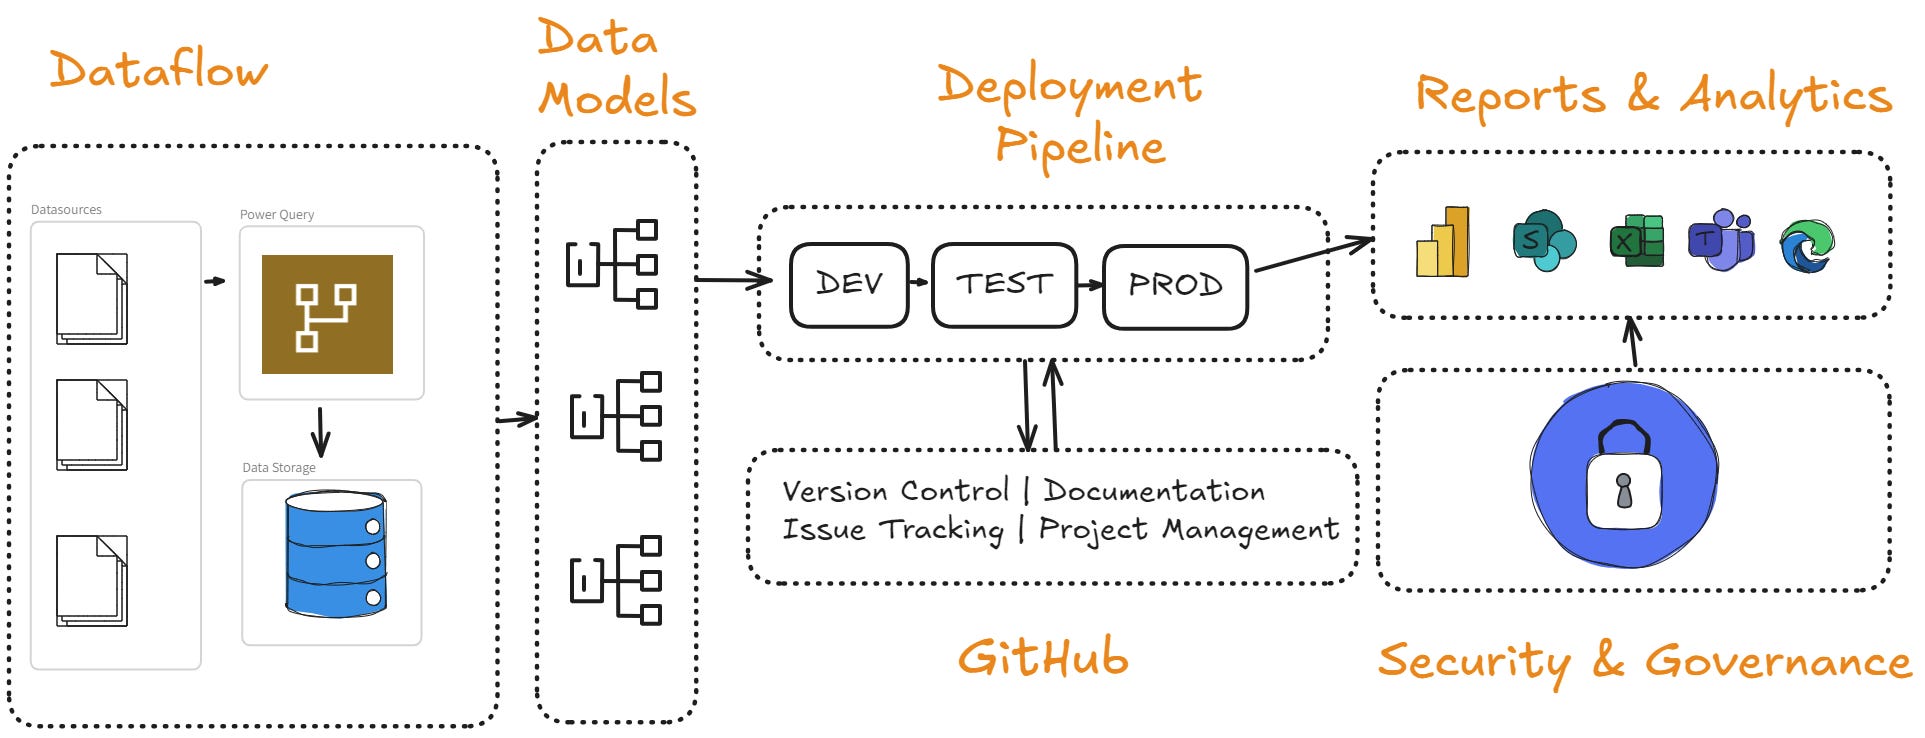
To turn these siloed sources into insight, we need a structured lifecycle. Here is an example framework.
The Ingestion Pipeline (The Intake)
All institutional dataflow starts here. Whether using Microsoft Fabric Dataflows, Tableau Prep, or custom ETL tools, the goal is identical: extraction, transformation, and normalization.
The Goal: Move from “manual exports” to repeatable, automated pipelines.
The Result: A clean, standardized foundation where the data is trusted before it ever reaches a report.
The Data Model (The Brain)
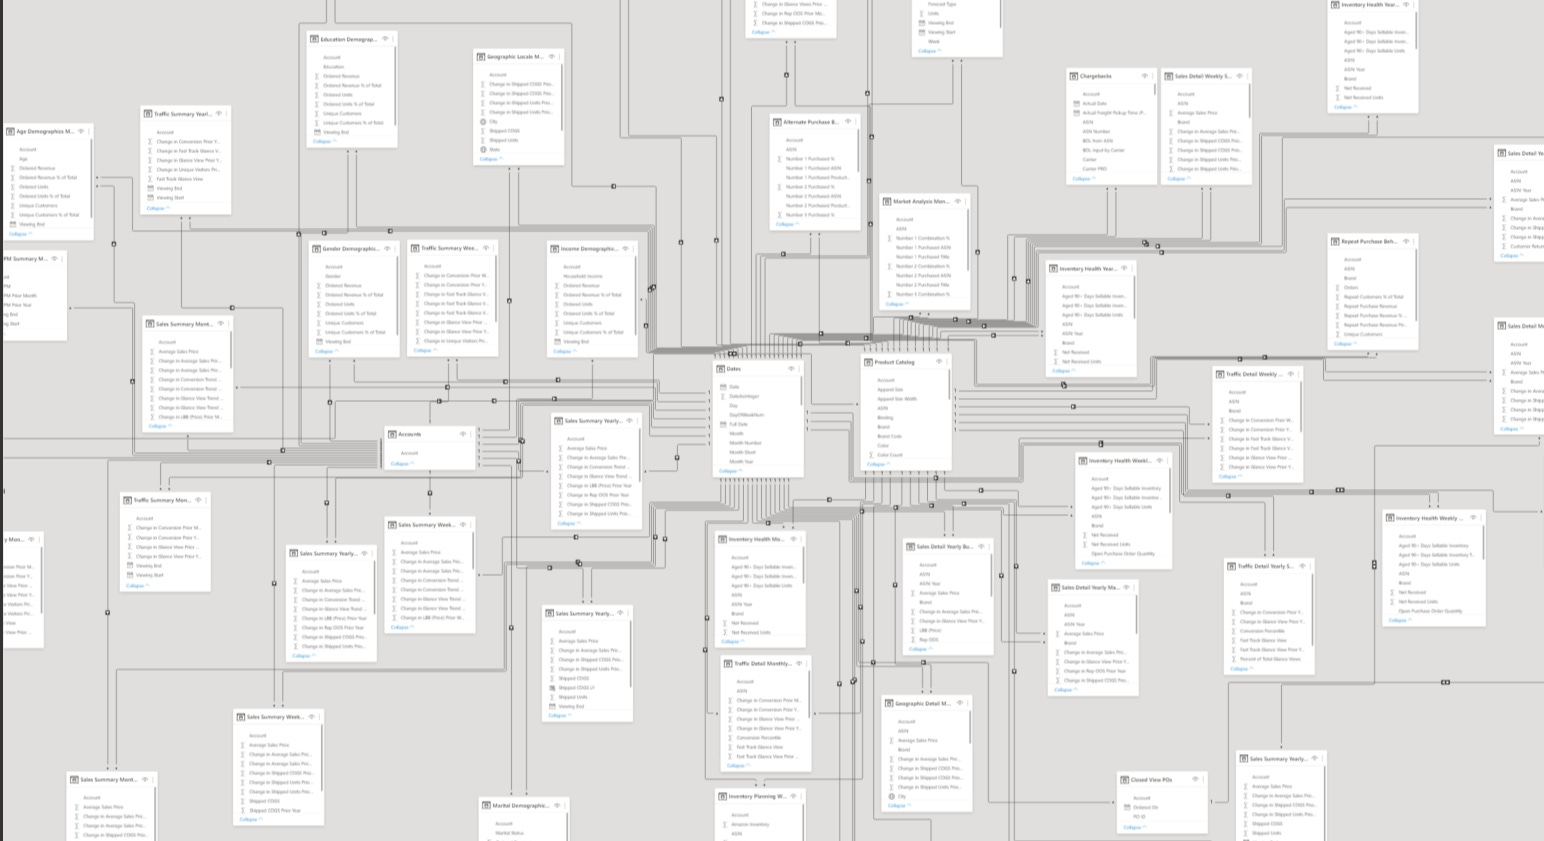
Once data is ingested, it must be shaped. In this layer, often a Microsoft semantic model or Tableau logical layer, we merge systems and define rules and calculations. This is where we establish cross‑system relationships, standardize definitions, and ensure consistency across domains.
We build measures, calculated columns, parameters, date tables, and time‑intelligence functions. In Power BI, the data model combined with DAX (Data Analysis Expressions) is a powerful expression language. Instead of looping through rows or merging datasets like in R, Python, or SAS, DAX creates calculated measures that operate across related tables without physically merging data.
Why it matters: This ensures that “Research Expenditure” means the exact same thing in the College of Engineering as it does in the Provost’s office.
GitHub and Code Management (The Governance)
This is the differentiator between a “spreadsheet culture” and an “engineering culture.” Even though tools like Power BI are low-code, the logic governing them should be treated like software. We use GitHub to separate the logic (report definitions, transformations) from the data (student records, financials, sponsored research, HR data etc.).
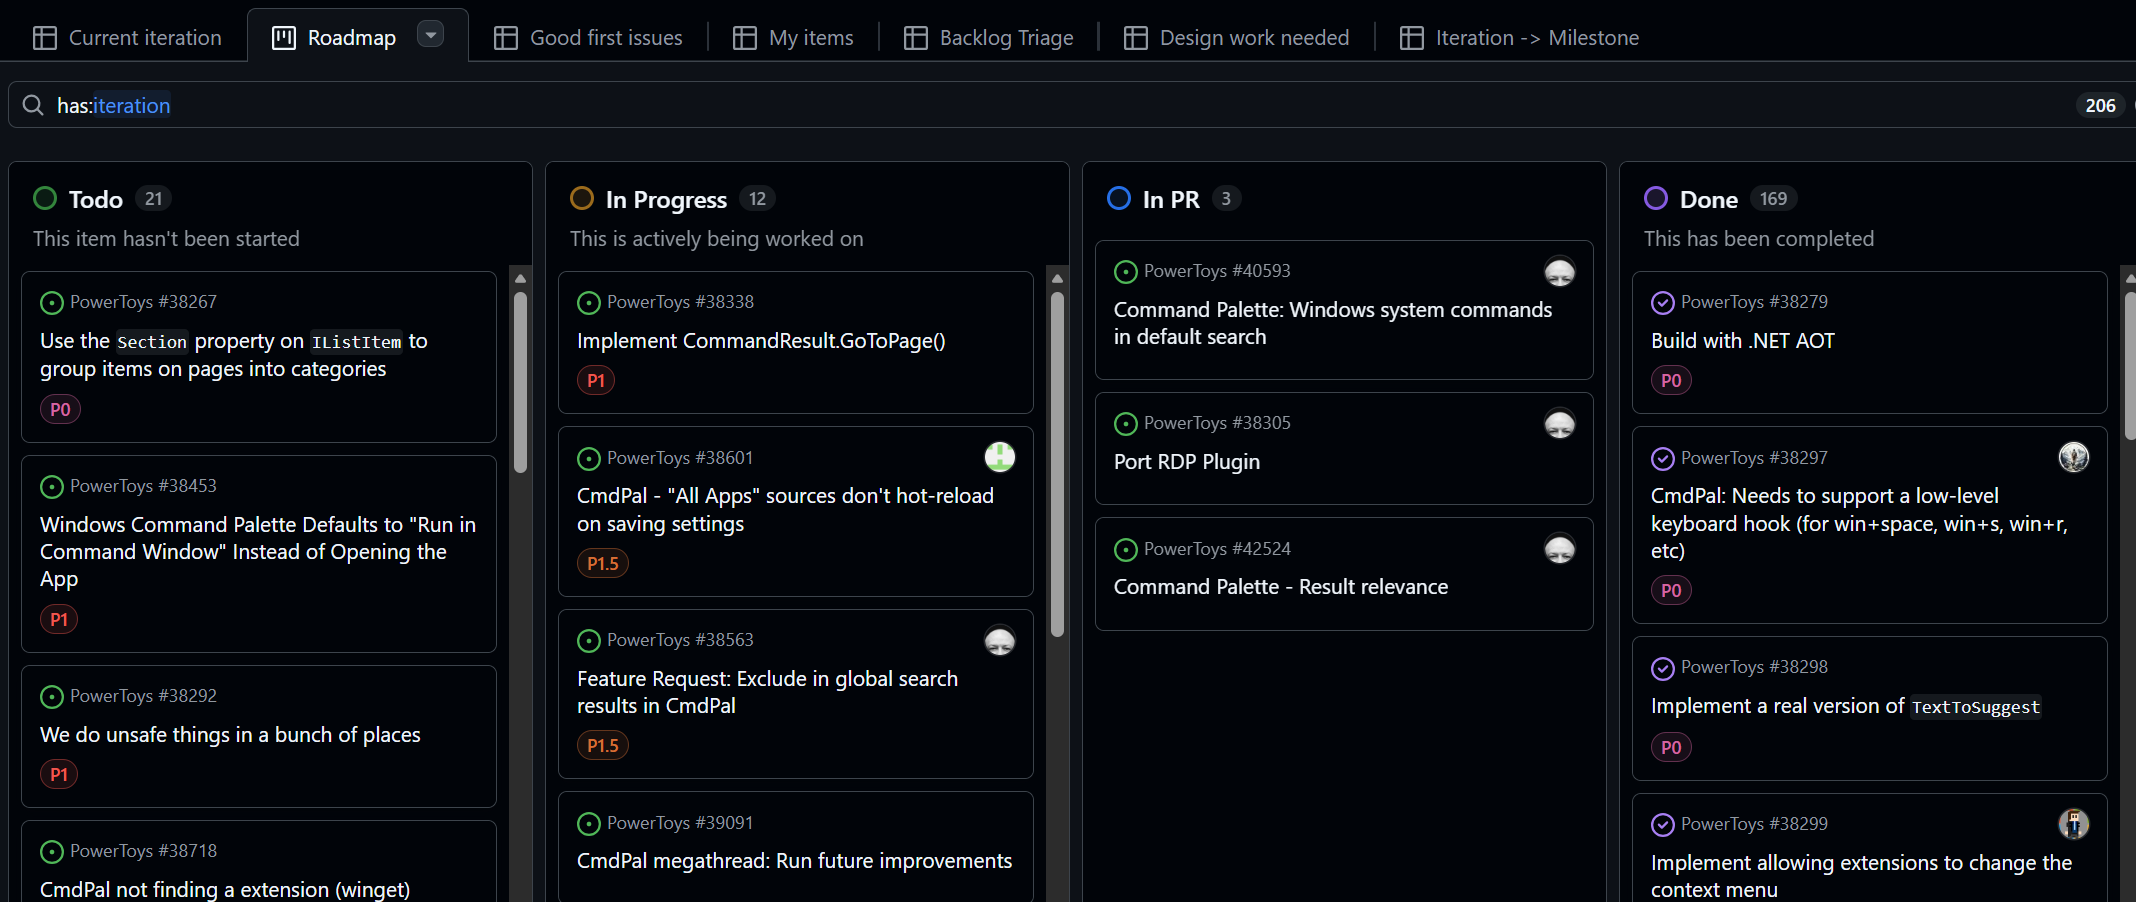
GitHub allows us to:
Version Control: Roll back to previous versions if a metric breaks.
Collaborate: Use branching and pull requests to manage changes safely.
Secure: Keep logic public/shared while keeping sensitive university data locked down.
For a deeper dive on how to use GitHub to manage projects (without writing code), read Part 1 of my series here.
The Deployment Pipeline (The Release)
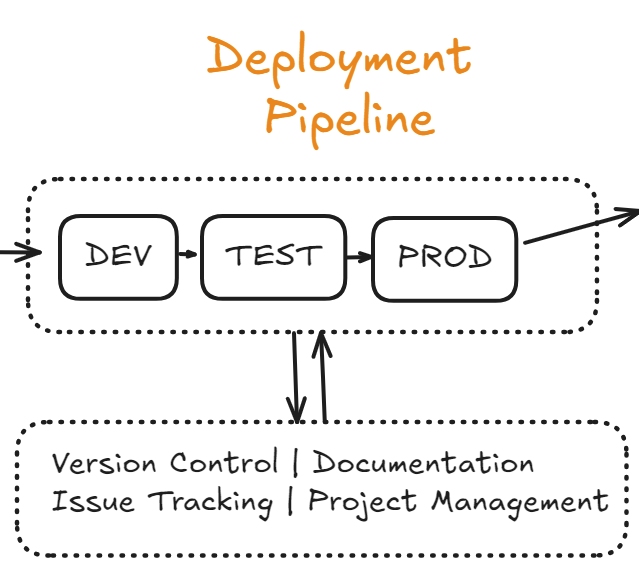
We never want to push changes directly to the production set of dashboards. Instead, we use a structured pipeline:
Development: Where we build and experiment.
Test: Where we validate accuracy with stakeholders.
Production: The live environment for decision-makers.
This ensures rigorous quality assurance and predictable updates.
Balancing Central vs. Local: The Unit-Level Ecosystem
A campus-wide system is powerful, but it can be slow. A major operational unit such as Research, Finance, or a large College needs to move faster.
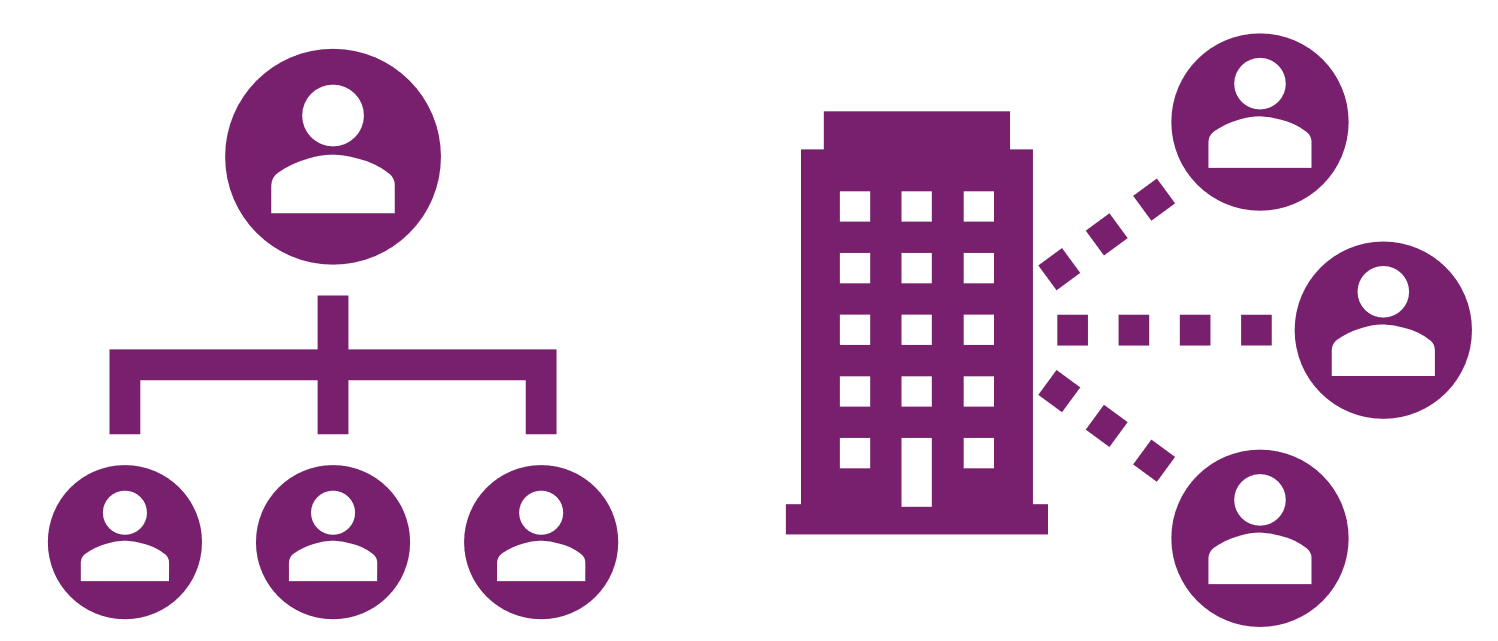
We need both campus level and Unit-Level Analytics Environments to be truly agile. Just as colleges and operational units have unique strategic plans and priorities, they also need specialized versions of the main lifecycle that allow specific teams to:
Iterate Quickly: Respond to operational needs in real-time.
Specialize: Build models aligned with deep domain expertise (e.g., bibliometrics for Research).
Experiment: Try new things without waiting for a campus-wide release.
This structure allows the university to have a “central truth” while empowering units to have “local agility.”
The Output: Decision-Ready Analytics
Ultimately, the technology serves the user. The production models feed downstream tools like Power BI, SharePoint, and Teams. This is where the work pays off, enabling:
Operational reporting for managers.
Executive dashboards for Deans and VPs.
Scenario modeling (”What if we increase grant targets by 10%?”).
Research collaboration insights.
To see how we implement these models technically, read my article on Elevating Strategic Metrics with Power BI and Cloud Integration.
Conclusion
This is more than a technical workflow; it is a strategic analytic framework. A modern analytics ecosystem only becomes valuable when its insights reach the people who make decisions. To get there, institutions must invest in a coordinated strategy to export, centralize, and unify data from traditionally siloed systems.
By adopting this framework, universities create a scalable, trusted foundation that empowers leadership to make decisions based on a single, consistent truth.